Naked Eye Limiting Magnitude: Redux
Having just tried to assess Naked Eye Limiting Magnitude from a dark site, I realised that my previous post on the subject merited some amendments.
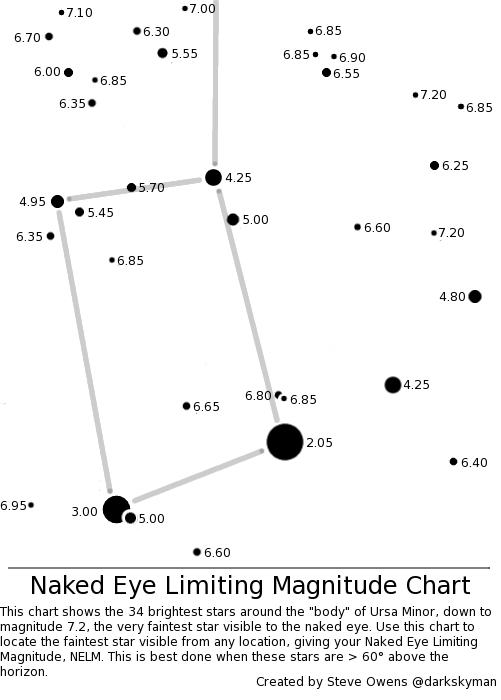
Rather than using the whole constellation of Ursa Minor to carry out your NELM estimate, it’s much simpler to use just part of it, that part around the “body” of UMi, roughly bounded by and immediately surrounding β, γ, ζ, and η UMi. Here’s a more detailed star chart of that part of the sky, with all 34 stars brighter than magnitude 7.2 labelled.

UMi detail down to mag 7.2
And here’s a list of the magnitudes of each of these stars:
| Star Number (Name) |
Magnitude | Star Number (Name) |
Magnitude |
| 1 (β UMi) | 2.05 | 18 | 6.55 |
| 2 (γ UMi) | 3.00 | 19 | 6.60 |
| 3 (ζ UMi) | 4.25 | 20 | 6.60 |
| 4 (5 UMi) | 4.25 | 21 | 6.65 |
| 5 (4 UMi) | 4.80 | 22 | 6.70 |
| 6 (η UMi) | 4.95 | 23 | 6.80 |
| 7 (θ UMi) | 5.00 | 24 | 6.85 |
| 8 (11 UMi) | 5.00 | 25 | 6.85 |
| 9 (19 UMi) | 5.45 | 26 | 6.85 |
| 10 | 5.55 | 27 | 6.85 |
| 11 | 5.70 | 28 | 6.85 |
| 12 | 6.00 | 29 | 6.90 |
| 13 | 6.25 | 30 | 6.95 |
| 14 | 6.30 | 31 | 7.00 |
| 15 (20 UMi) | 6.35 | 32 | 7.10 |
| 16 | 6.35 | 33 | 7.20 |
| 17 (3 UMi) | 6.40 | 34 | 7.20 |
As you can see, it’s much easier to fine-tune your NELM estimate using this chart compared to the previous one, as there are not such big jumps between brightnesses from one star to the next.
Colours in this table correspond to the Bortle Scale colour key.
Crucially, one thing I omitted to note in the previous post was that this process should be carried out when your target stars are high above the horizon. The stars of Ursa Minor, when observed from the UK, vary in altitude between 40° and 70° roughly speaking, so ideally you’d wait until they were higher than 60° above the northern horizon.
| Month | Times when Kocab (β UMi) alt > 60° |
| mid Jan | 0300 till start astronomical twilight (~0600) |
| mid Feb | 0100 till start astronomical twilight (~0530) |
| mid Mar | 2330 till start astronomical twilight (~0430) |
| mid Apr | 2230 till start astronomical twilight (~0400) |
| mid May | end astronomical twilight till start astronomical twilight |
| mid Jun | no hours of darkness |
| mid Jul | no hours of darkness |
| mid Aug | never > 60° during hours of darkness |
| mid Sep | never > 60° during hours of darkness |
| mid Oct | never > 60° during hours of darkness |
| mid Nov | never > 60° during hours of darkness |
| mid Dec | 0500 till start astronomical twilight (~0630) |
UPDATE: Here’s the chart with the magnitudes written directly beside each star.
Leave a comment
Buy my new book

That is a helpful chart. Is it possible to mark the stars directly with their magnitude? I have a similar chart, but not showing as many stars, that I bring with when observing.
I’ve seen charts where the magnitude is written near the star, without the decimal point. That point is too easy to mistake for a star. The value 2.05 would be shown as 205.
Also, because it shows so many stars, it might be helpful to draw lines between the stars of the asterism. It would help to get a bearing when looking at the chart.
I know this might make for a cluttered chart. I’m just throwing out some ideas.
-Bob
Hi Bob,
Great suggestions. Feel free to download the image and play around with it to make it work for you. Let me know how you get on with it.